
This page provides an up to the minute summary of data currently available in the database. Parameters reported include minimum and maximum reported genomes sizes (in picograms), mean genomes sizes with standard error (SE), total number of species assayed, and the methods, cell types, and standards used for all available records. Note that the statistics reported here are based on all records in the database -- for maximum reliability, you are encouraged to evaluate the data for your particular group of interest directly. Note also that these C-value summaries do not currently account for instances of polyploidy (though this will be updated in the future).
Because these statistics refer to the database as a whole, they must be cited as follows if used in a publication:
- Gregory, T.R. (2005). Animal Genome Size Database. http://www.genomesize.com.
Please select your group of interest from the list:
- Entire Database (i.e., all animals)
- All Chordates | Amphibians | Birds | Fishes | Mammals | Reptiles
- All Invertebrates | Annelids | Arachnids | Crustaceans | Echinoderms | Flatworms | Insects | Molluscs | Nematodes
- Methods, Cell Types, and Standard Species
(Other invertebrate groups are insufficiently represented for summary stats)
Entire Database
| Number of species/subspecies available: | 6534 (3863 Vertebrates, 2671 Non-Vertebrates) |
| Smallest animal genome size: | 0.02pg, Pratylenchus coffeae, Plant-parasitic nematode |
| Largest animal genome size: | 132.83pg, Protopterus aethiopicus, Marbled lungfish |
A comment on the overall animal range:
Vinogradov (2005) recently argued that the largest genome size among animals is found in the South American lungfish Lepidosiren paradoxa at 80pg, and that Pedersen's (1971) measurement of the marbled lungfish Protopterus was greatly overestimated. However, Vinogradov did not measure P. aethiopicus, he measured P. dolloi. As a result, the largest animal genome reported remains 133pg for P. aethiopicus, followed by the amphibians Necturus lewisi and N. punctatus at 120pg*, followed by the amphibians Necturus maculosus and Amphiuma means and the lungfish Lepidosiren paradoxa (if one accepts Vinogradov's new estimate; three older studies placed it at 113-124pg), all at roughly 80pg.
* Both studies reporting the value of 120pg for N. lewisi and N. punctatus also reported ~80-90pg for N. maculosus, in agreement with more recent flow cytometric estimates.
A comment on the overall eukaryote range (see also Gregory 2005a):
At present, the range in published eukaryote genome sizes is between about 0.0023pg in the parasitic microsporidium Encephalitozoon intestinalis (Vivares 1999), and 1,400pg in another protist, the free-living amoeba Chaos chaos (Friz 1968) a greater than 600,000-fold difference. The largest genome size is often attributed to Amoeba dubia at 700pg, conveniently 200 times larger than a humans (e.g., Gregory and Hebert 1999), and sometimes Encephalitozoon cuniculi is considered the smallest at about 0.0029pg (Biderre et al. 1995), for a more than 200,000-fold range (e.g., Gregory 2001b). Many previous publications have taken brewers yeast Saccharomyces cerevisiae at 0.008pg to be the lowest eukaryotic C-value, for a range of about 80,000-fold (e.g., Gregory and Hebert 1999; Pagel and Johnstone 1992), although some authors calculate the range as 40,000-fold (e.g., Cavalier-Smith 1978).
In any case, a few caveats are in order regarding the high end of this range. First, these values for amoebae were based on rough biochemical measurements of total cellular DNA content (Friz 1968), which probably includes a significant fraction of mitochondrial DNA. The accuracy of this method is brought into question when one considers that Friz's (1968) value of 300pg for Amoeba proteus is an order of magnitude higher than those reported in subsequent studies (Byers 1986). Second, some amoebae (e.g., A. proteus) contain 500-1000 small chromosomes and are quite possibly highly polyploid (Byers 1986), in which case these values would be inappropriate for a comparison of haploid genome sizes among eukaryotes. Of course, this has little impact on the need to explain variation in genome size; it may just mean that these impressive examples will require replacement by some based on more reliable estimates.
Below is a summary figure (from Gregory 2004a).
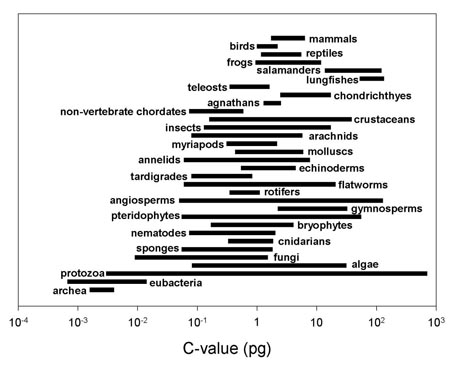
(Note: the groups in this figure are arranged along made-up "scala naturae" to emphasize the lack of relationship between genome size and intuitive notions of organismal complexity -- please do not construe this figure as an endorsement of a progressionist view of evolution!).